Screens
Visual information is presented on various screens in On Key. The following types of screens are discussed below: Dashboard, Recursive Dashboard, Create and Edit.
Dashboard
The dashboard is a container that can display any visualisation. The dashboard is also context-sensitive. So, depending on where you are in On Key, the data on the dashboard can be presented in different formats.
The following visualisations can be displayed on the dashboard:
- Grid
- Tree
- Custom Visualisation
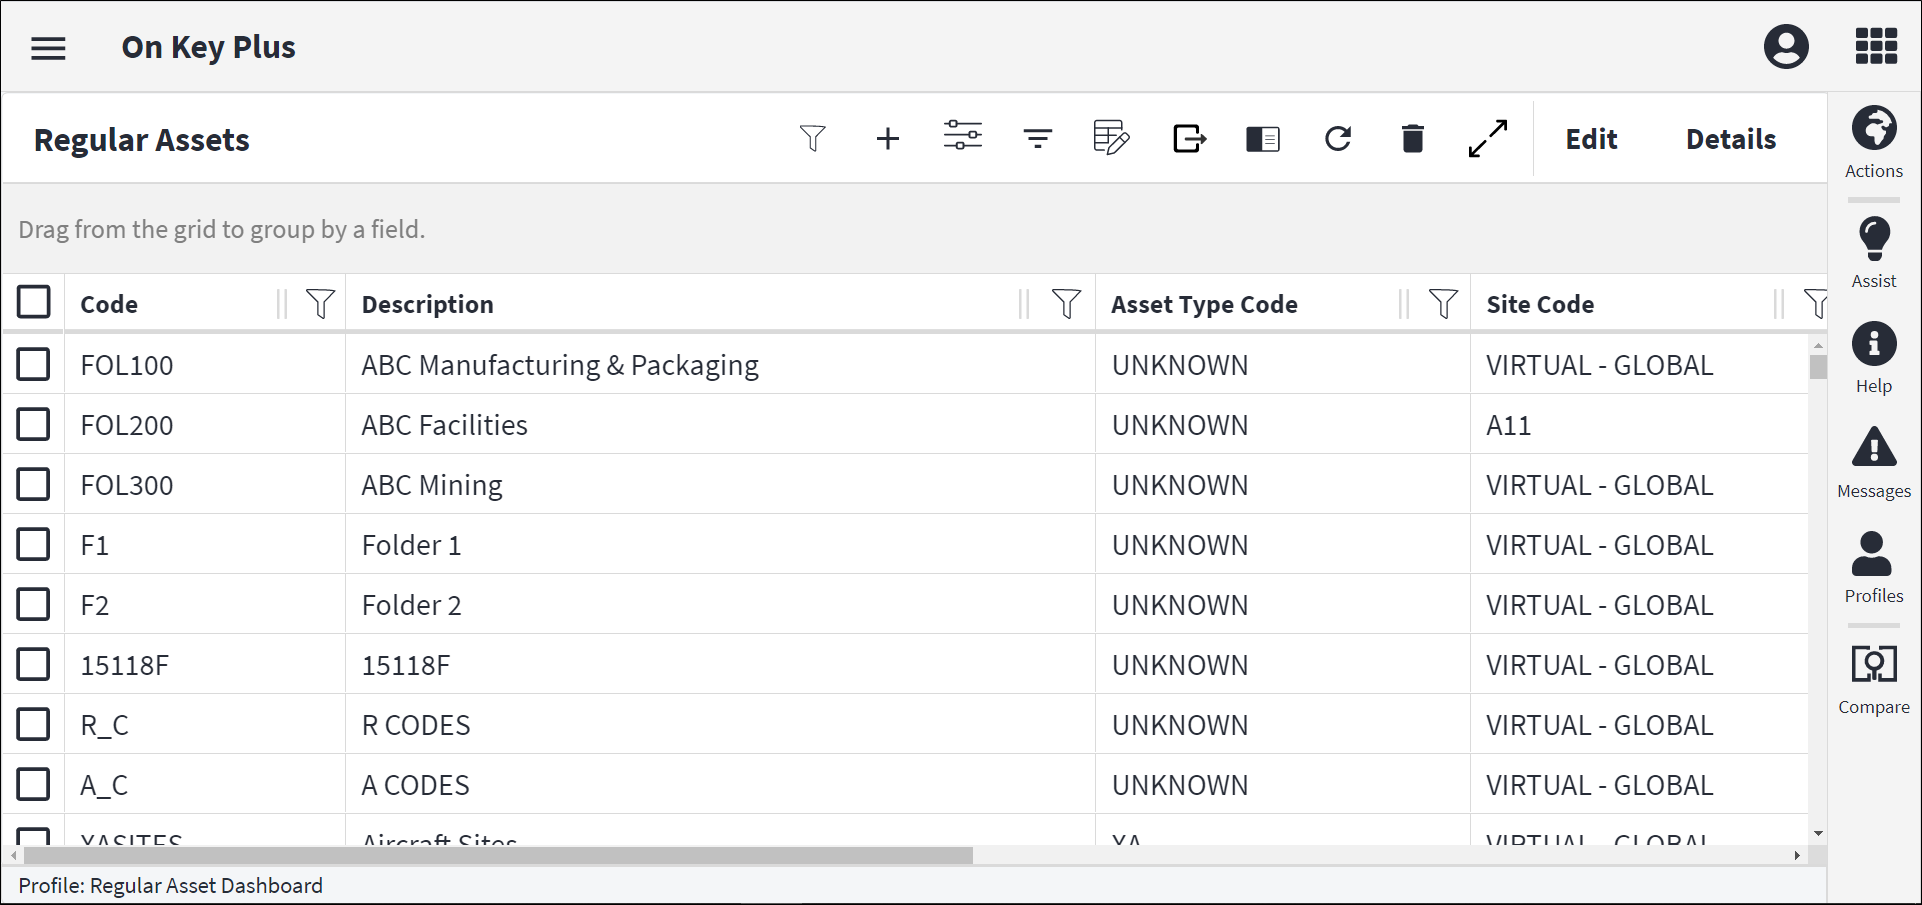
A dashboard can contain a grid, displaying records in a grid list containing columns for specific fields. Reposition columns by dragging and dropping the column header at the desired position. Drag the columns to the grouping bar above the grid to group the records by field. There is a limit of 100 000 records that can be retrieved on a grid.
Where relevant, the grid for asset register items will include the asset type path or asset path, and/or the component path. These paths are also displayed on the Work Order Task Dashboard. This column in the grid identifies the path of the asset type, asset or component to which the item belongs. So, for a regular asset task, for example, the Asset Tree Path column on the grid indicates where the regular asset task lives in the asset tree.
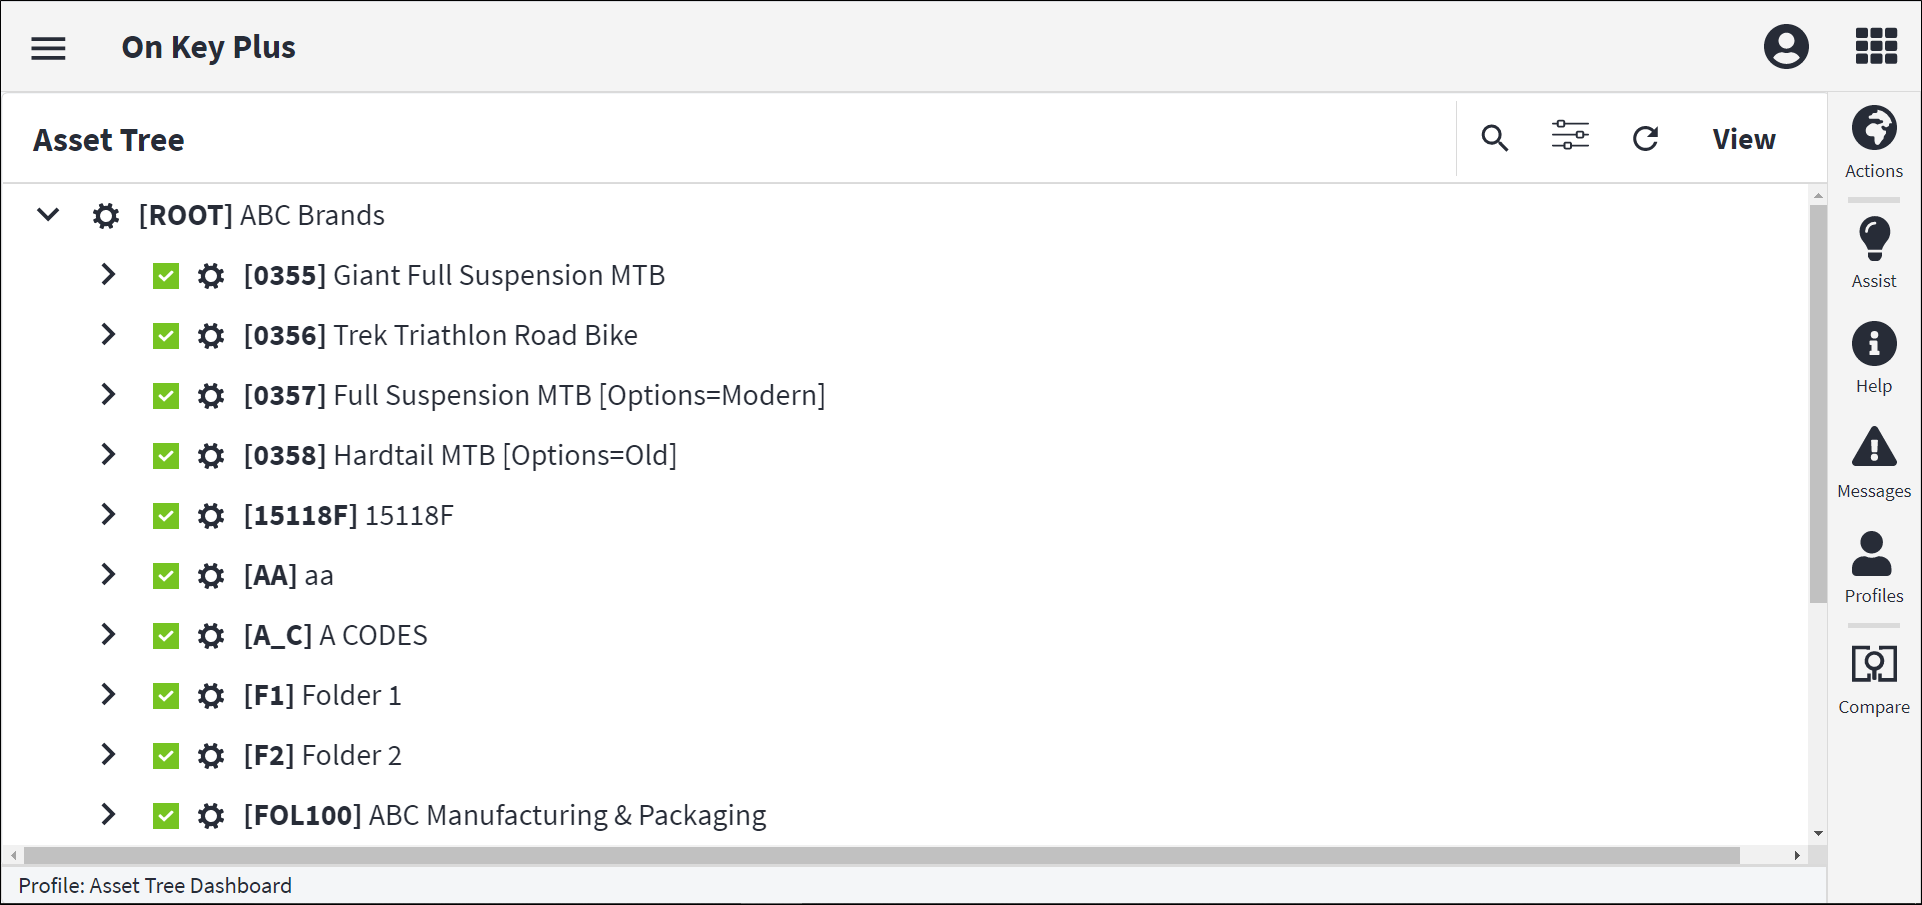
The asset type tree dashboard and the asset tree dashboard contain tree structures. Here, the data displays in a hierarchical structure which shows the parent-child relationship of related items. A tree structure can be expanded and collapsed to display the hierarchical relationship between associated items.
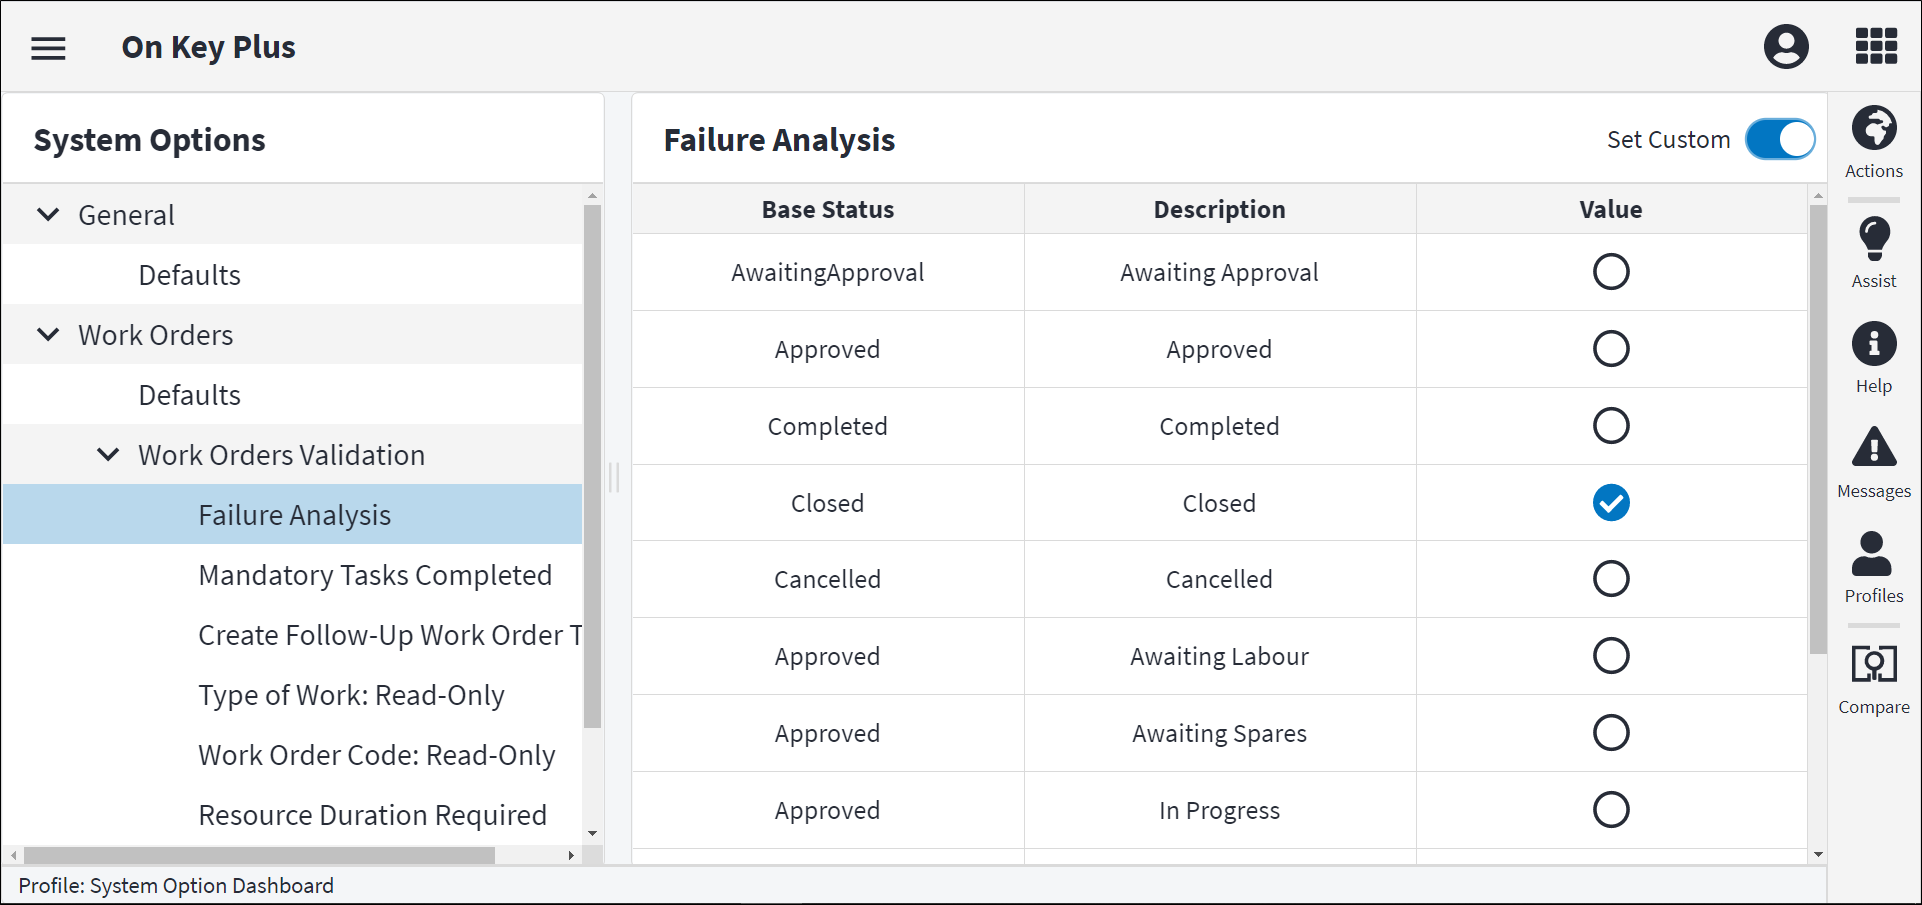
A dashboard does not necessarily have to contain a grid or a tree. A dashboard for a specific entity could also contain a custom visualisation that will enable you to see and interact with the data in its entirety, such as a chart or a matrix, for example.
The dashboard also has a Toolbar, which can contain various tool functions depending on your current context in On Key. For more information on the tools that relate specifically to grids and trees, refer to Grid Tools and Tree Tools.
Recursive Dashboard
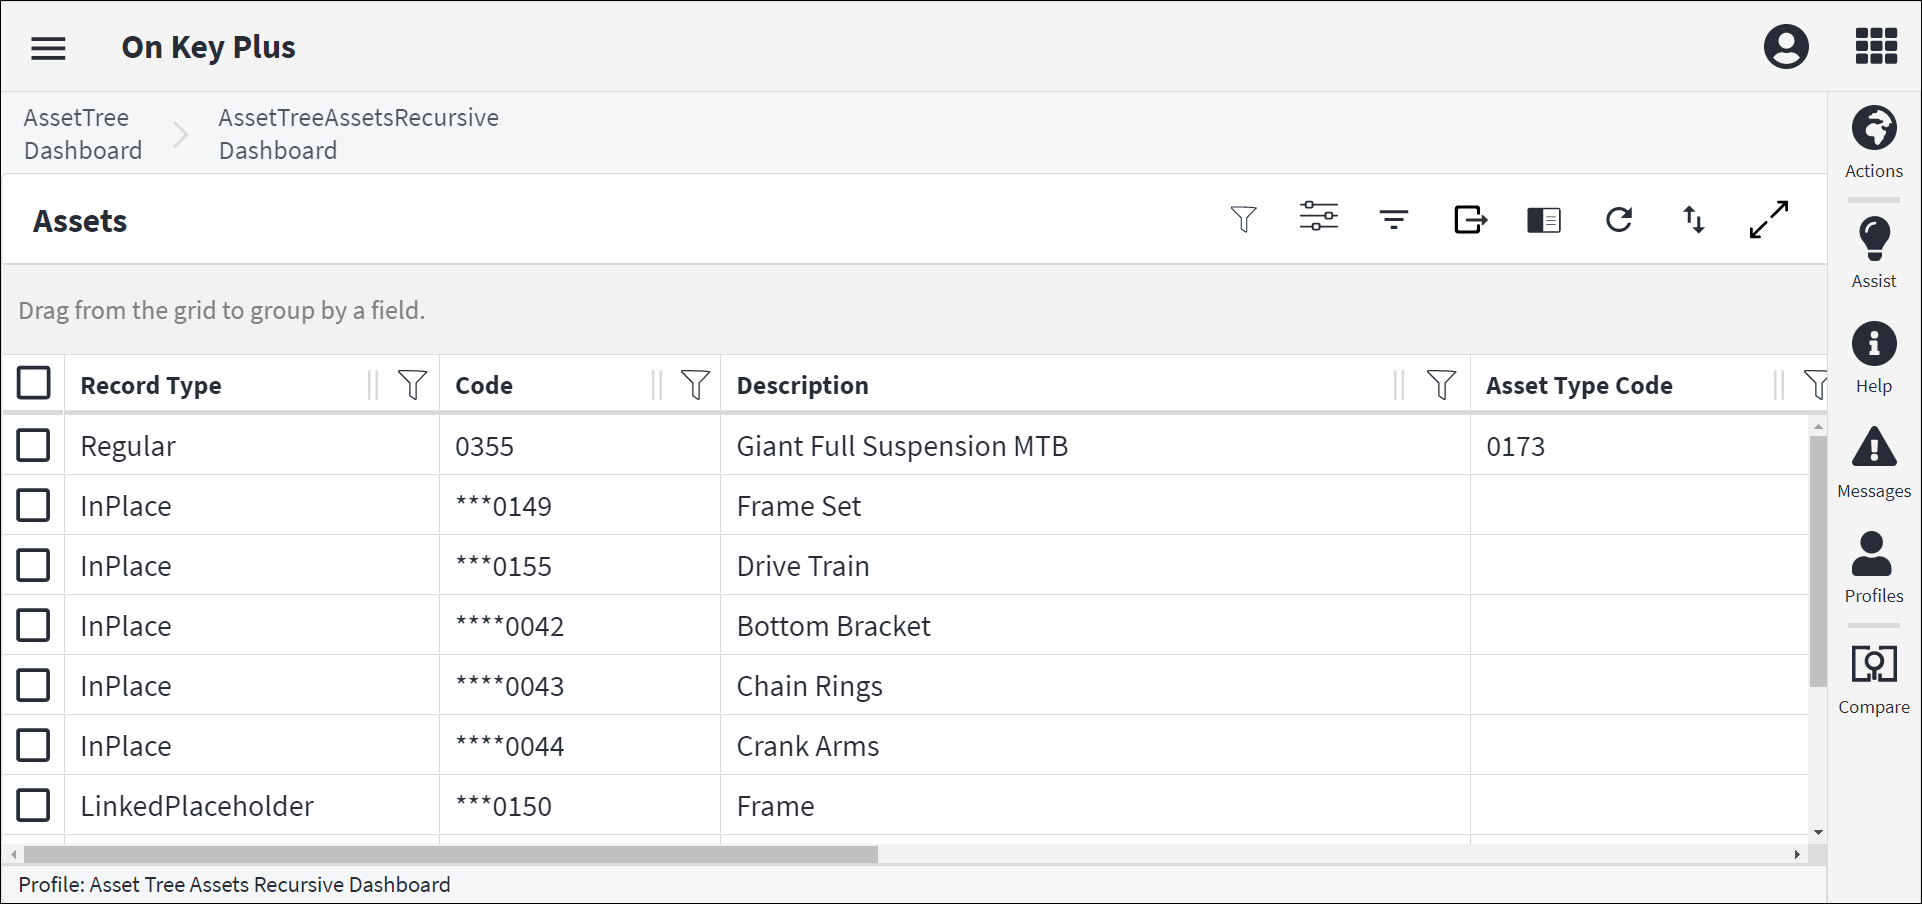
A recursive dashboard is opened from a node in the asset tree or asset type tree. It is used to browse the assets or asset types, components, work orders or tasks that belong to a specific entity, from that point in the tree, down. It enables you to view all the related entities from a specific point in the tree, down, including the current node.
There are entity-specific recursive dashboards, such as the Regular Asset Task Recursive Dashboard, for example, which shows all the regular asset tasks for an entity, from that point in the asset tree, down. You are also able to view "all" recursive dashboards, such as the Assets Recursive Dashboard, which shows all the regular assets, in-place assets and placeholder assets, from that point in the tree, down.
To access a recursive dashboard, right-click the applicable node in the asset tree or asset type tree, click Browse, then select the entity to browse to. To return to the tree, click the dashboard's name in the breadcrumb trail.
Please note, when accessing the On Key Assist from a recursive dashboard, you first need to select a record in the grid in order for the relevant options to populate the Assist. This is because recursive dashboards can contain multiple entity types, whereas the normal dashboard (which is accessed from the main menu) only contains information for a single type of entity.
Furthermore, since recursive dashboards can span across multiple entities, a user needs the generic entity "View" permissions to be able to view multiple entity types. So, for instance, a user would need the Asset View permission, the Asset Component View permission, and so on to be able to browse all the entities that a recursive dashboard could contain.
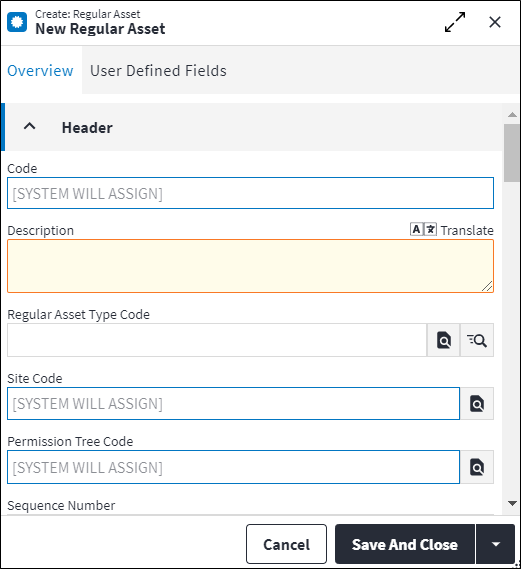
Create
The create screen is used to insert a new record on the dashboard. The create screen is accessed by clicking ![]() in the toolbar.
in the toolbar.
The create screen contains a tab bar with one or more tabs that apply to the record. Each tab lists fields that are grouped in sections.
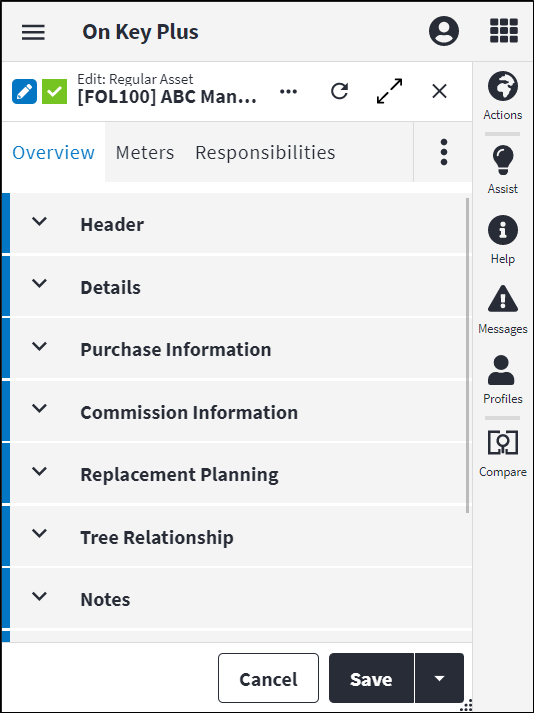
Edit
The edit screen is used to modify or add data to a record that already displays on the dashboard. Double-click the record or item to open the edit screen, or select the record, then click Edit in the toolbar.
The edit screen contains a tab bar with one or more tabs that apply to the record. Each tab has fields that are grouped in sections. A tab could also display a visualisation, such as a grid, with a toolbar that provides quick access to the available tools for the record.
The fields on the edit screen as well as the information to be inserted on these fields are explained in the Help File, under the screen description for each relevant entity.
Click ![]() to display the following actions:
to display the following actions:
- Refresh: This refreshes the selected item to display updated information.
- Undo: This undoes unsaved changes made to the item.
- Delete: This deletes the selected item.
For more information on the tools related to various types of screens, refer to Screen Tools.